Checking your graphics card’s temperature, also known as GPU temperature, is an important part of PC maintenance and troubleshooting. Maintaining healthy GPU temps helps prevent overheating issues and potential damage over time. Knowing how to monitor GPU temperature allows you to optimize fan curves, diagnose performance issues, and ensure your expensive graphics card hardware is running safely and efficiently.
In this complete guide, we’ll cover the most effective ways to check GPU temperature on all modern graphics cards including Nvidia and AMD. We’ll discuss both software and hardware monitoring options, best practices for reading temperature sensors, normal temperature ranges, and what to do if temperatures get too high. By the end, you’ll have a full understanding of GPU temperature monitoring and be able to keep your graphics card running at an optimal temperature.
Why Is Checking GPU Temperature Important?
There are several key reasons why regularly checking graphics card temperature is important for your system:
- Preventing Overheating Issues – The number one reason to monitor GPU temps is to avoid damaging your graphics card from excessive heat. Most graphics cards have a thermal threshold where they will start to throttle performance or shut down altogether to prevent damage. Knowing your temps lets you address issues before reaching this point. What Is 10 Core graphics cards are especially susceptible to overheating issues due to their powerful processors, so monitoring temperatures is very important when using a high-end GPU.
- Optimizing Cooling Performance – Understanding your GPU’s operating temperature range allows you to optimize your case cooling setup and GPU fan curves. It helps identify if additional cooling may be needed or if fan speeds can be lowered for less noise.
- Diagnosing Problems – Sudden increases in GPU temperatures could indicate cooling faults like failed fans or issues with thermal paste/pads. Checking temps provides diagnostic data when troubleshooting performance or stability problems.
- Extending Hardware Lifespan – In general, the cooler a component runs the longer it will last. Monitoring temperatures helps ensure your graphics card is operating within a safe temperature window to maximize its longevity over many years of use.
- Overclocking Safety – When overclocking your GPU, keeping an even closer eye on temps is crucial. Overclocks that are too aggressive can cause dangerous overheating if not properly cooled. Monitoring prevents damage from reckless overclocking.
For all these reasons, setting up GPU temperature monitoring should be considered an essential part of regular PC maintenance and troubleshooting tasks. Knowing your temps provides critical information about your system’s health and performance stability.
Normal GPU Temperature Ranges
Before getting into specific monitoring methods, it’s helpful to understand typical healthy temperature ranges for modern graphics cards at different loading states:
Idle Temperatures:
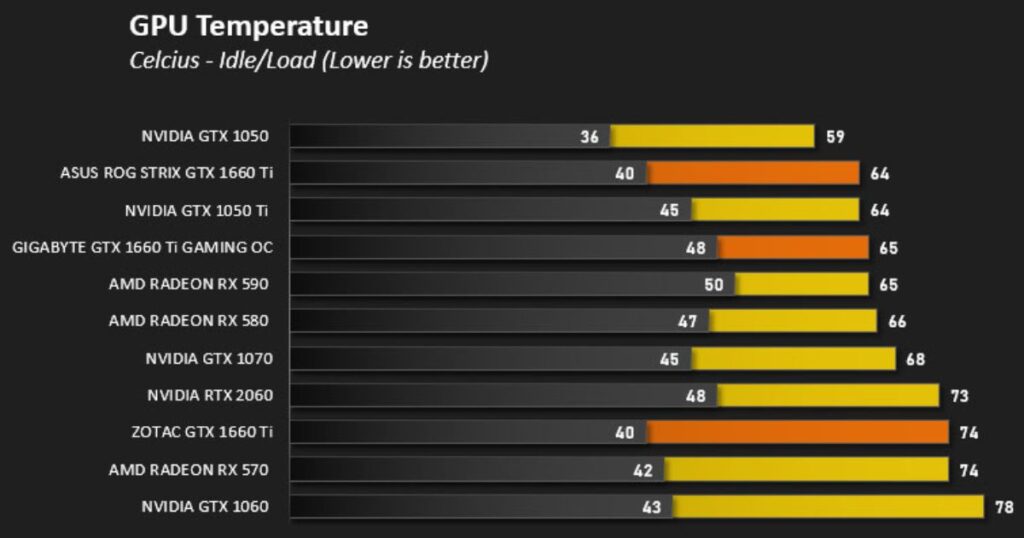
- Nvidia GPUs – Around 30-45C
- AMD GPUs – Around 35-55C
Light/Medium Usage Temperatures:
- Nvidia GPUs – Around 45-75C
- AMD GPUs – Around 50-80C
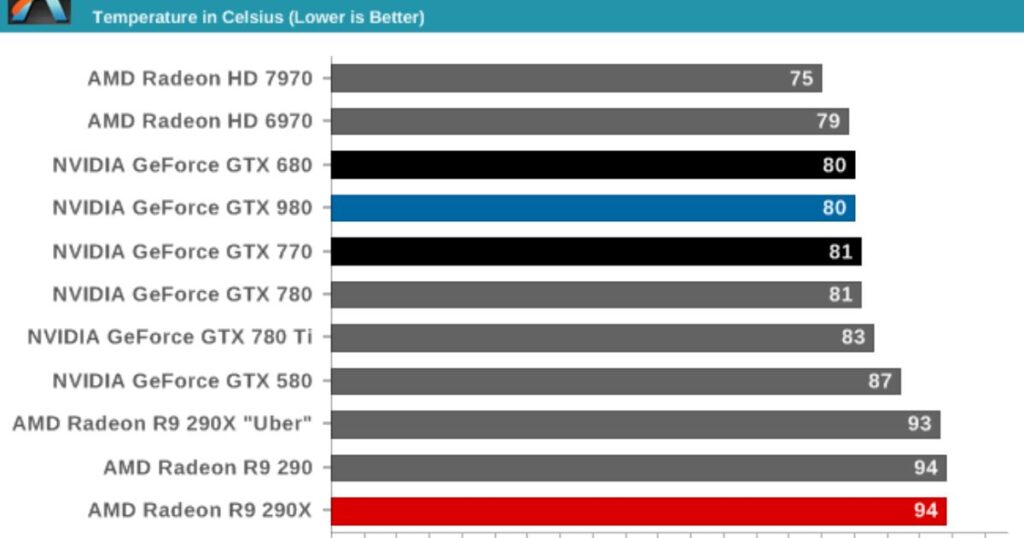
Full Load While Gaming/Benchmarking:
- Nvidia GPUs – Below 85C ideal, up to 95C maximum
- AMD GPUs – Below 85C ideal, up to 100C maximum
These are general guidelines, but every card model and cooling setup is different. Temperatures 10°C above or below these numbers could still be acceptable. The key things to watch out for are throttling behavior above 95°C and any sudden spikes upwards of 100°C during regular use.
As long as your card stays within these broad ranges under different loads, temperatures are likely healthy and safe. Monitoring allows you to know “your normal” for each specific GPU model and case cooling configuration. Now let’s look at some ways to check the temperature.
Nvidia GPU Temperature Monitoring Options
For Nvidia graphics cards, the main software options for GPU temperature monitoring include:
- Nvidia GeForce Experience – The Nvidia driver software includes basic temperature monitoring built right into the overlay. Just press ALT+R to bring up stats while gaming or benchmarking.
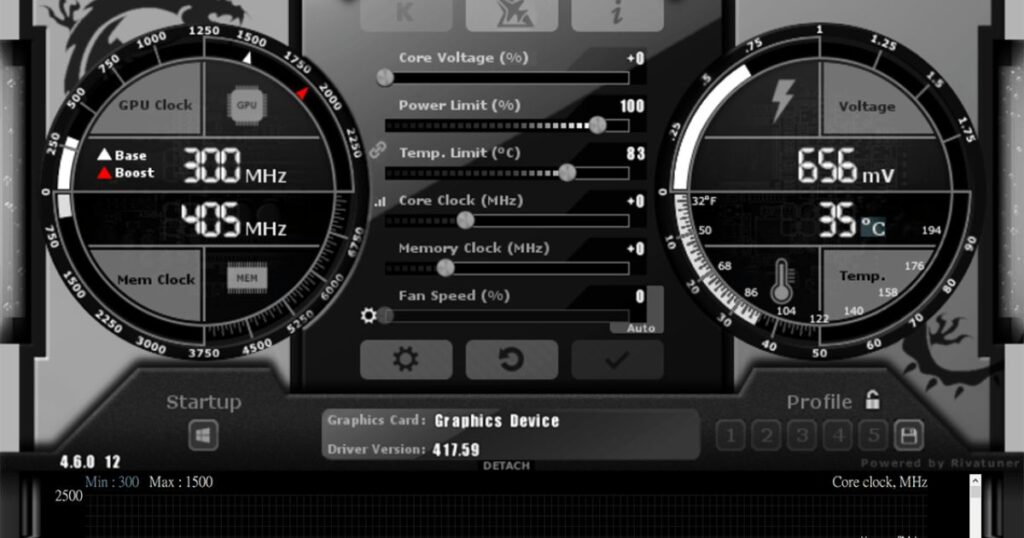
- MSI Afterburner – The GPU overclocking utility MSI Afterburner has very robust temperature monitoring and logging capabilities. Highly recommended for serious monitoring.
- HWiNFO – A versatile system information tool that reads sensors from all hardware including accurate Nvidia GPU temperature readings.
- Nvidia Inspector – Less robust than the other options but can show real-time GPU sensor panels within the driver software.
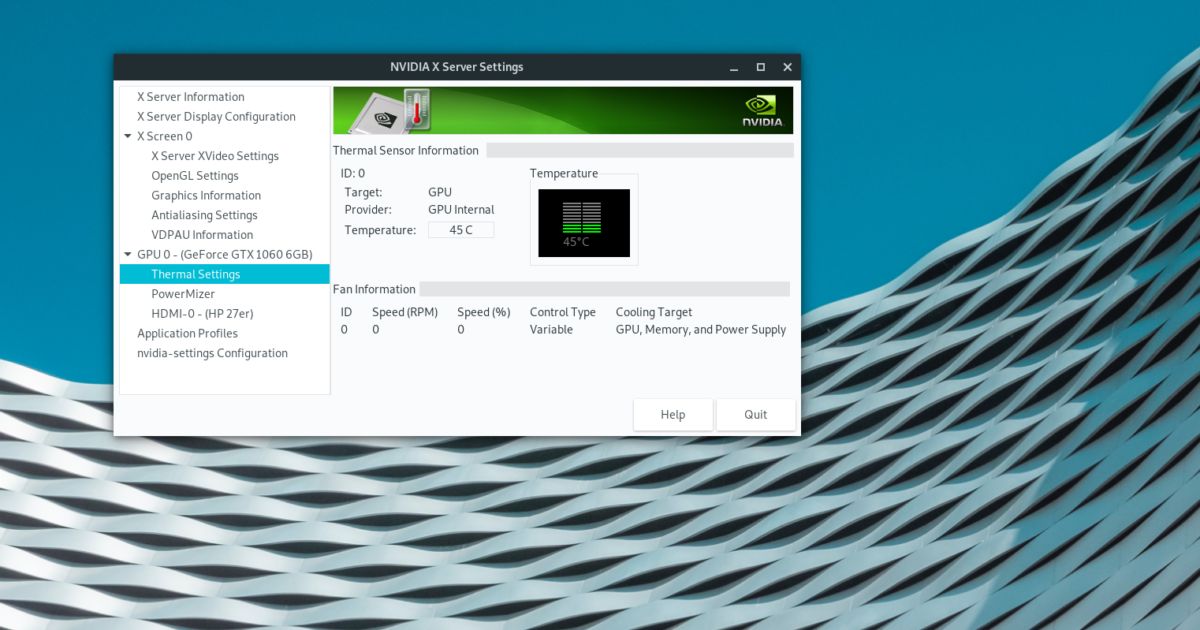
These software tools all pull the GPU temperature reading directly from Nvidia hardware sensors. The reading will match what actual hardware monitoring circuits are reporting on the graphics card PCB itself.
For a basic physical LED readout of temps, many high-end Nvidia cards also have a digital LED display on the I/O bracket. This shows a real-time temperature value for troubleshooting without software.
Setting Up Nvidia Monitoring With MSI Afterburner
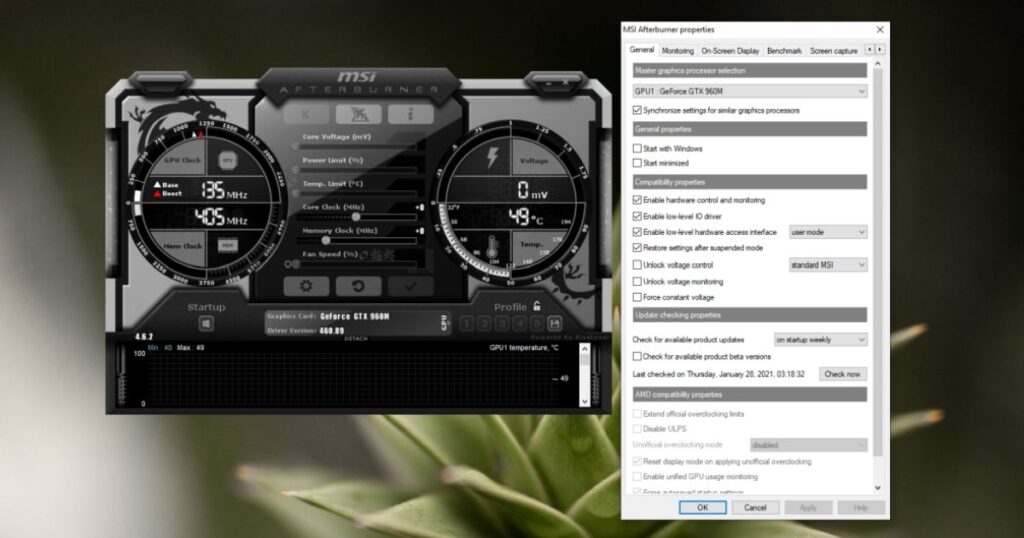
MSI Afterburner is regarded as one of the best options for thorough Nvidia GPU temperature monitoring due to its extensive overlay customization. Here are the basic steps to configure temperature monitoring with Afterburner:
1. Download and install the latest version of MSI Afterburner.
2. Launch Afterburner and go to the “Monitoring” tab.
3. Check the box next to “GPU Temperature” to enable temperature monitoring.
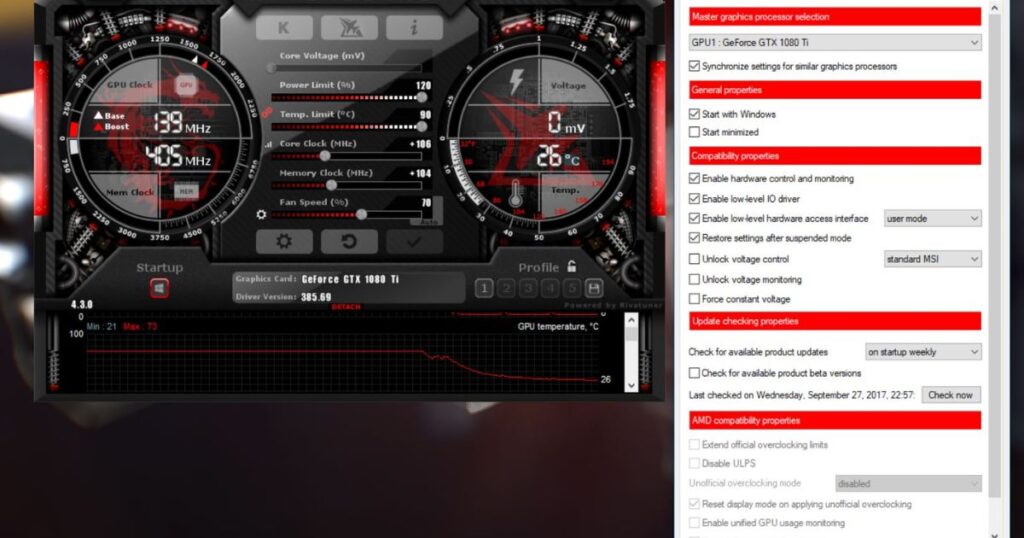
4. Right click the temperature reading and select “Add to On-Screen Display.”
5. Configure the On-Screen Display overlay position and transparency to your preference.
6. You can now monitor the GPU temp in-game by pressing ALT+R or Tab out to see the reading on the desktop.
7. For logging, go to the “Settings” tab and enable “Logging” to record temperatures over time in a CSV file.
With Afterburner configured, you now have an always-visible and recorded readout of your GPU’s temperature to monitor regularly. Let Afterburner run passively in the background for ongoing temperature tracking.
AMD GPU Temperature Monitoring
Monitoring temperature on AMD graphics cards is very similar with comparable software and hardware options available:
AMD Radeon Software
Formerly known as Catalyst/Crimson, AMD’s driver control panel includes basic sensor readouts when you click the system tab.
MSI Afterburner
As with Nvidia, Afterburner is fully compatible with overlay monitoring and logging AMD temps as well.
HWiNFO
AMD sensor readings including temperature are visible within HWiNFO just like Nvidia cards.
Some high-end AMD cards also have LED temperature displays built onto the I/O bracket like certain models from PowerColor or Sapphire.
Within the Radeon Software control panel, GPU temperature can be viewed by clicking the system tab on the left sidebar and then looking at the temperature sensor readout. MSI Afterburner works identically as well for AMD overlay monitoring and logging.
So in summary, all the mainstream options like Radeon Software, HWiNFO, and MSI Afterburner provide accurate temperature readings pulled directly from AMD hardware sensors on the graphics card.
Setting Up AMD Temperature Monitoring With Afterburner
Here are the steps to set up AMD GPU temperature monitoring using MSI Afterburner:
1. Download and install the latest version of MSI Afterburner.
2. Launch Afterburner and select your AMD GPU from the drop-down menu if multiple GPUs are installed.
3. Navigate to the “Monitoring” tab and check “GPU Temperature.”
4. Right-click and add the temperature sensor to the On-Screen Display overlay.
5. Configure the overlay position and transparency in the “Settings” tab.
6. You can now monitor temps in-game or on the desktop at all times in the overlay.
7. For logging, enable it in the “Settings” tab to record a temperature CSV file over time.
With these basic Afterburner settings, you’ll have the ability to constantly monitor your AMD graphics card’s temperature both visually and in easily accessible log files.
Interpreting Unusual GPU Temperature Readings
While the ranges provided earlier indicate typical healthy GPU temperatures, it’s possible to see some unusual readings depending on your specific setup and components. Here are some cases where temperatures may seem abnormal:
- Extremely High – Consistently exceeding 95°C even at light loads could mean poor airflow, failed cooling fans, or inadequate thermal paste/pads requiring maintenance.
- Extremely Low – Readings below 30°C even at full load may indicate a faulty sensor connection or inaccurate temperature reading needs calibration.
- Fluctuating Wildly – Temperatures rapidly changing 10°C or more without load changes could point to faulty sensors, cooling, or contact issues needing troubleshooting.
- Differing by Brand – Some brands may routinely run marginally cooler/hotter than others due to design even with identical loads. 10°C discrepancies are generally fine.
- Case Restrictions – Temps can be higher in tightly packed cases with poor ventilation compared to open-air bench setups even with identical components.
- Thermal Pads/Paste Aged – Over time as thermal materials degrade, temps may slowly creep up 10°C or more signaling maintenance needs done.
So in any unusual temperature situations, the key things to check are fan speeds, heatsink contact, case ventilation, thermal paste/pad condition, and potential faulty sensors needing replacement. Isolating variables helps diagnose root causes.
Addressing High GPU Temperatures
If your GPU temperature monitoring reveals consistently high temps exceeding safe ranges, here are some remedies to try bringing them back down:
- Clean Out Dust – Remove dust buildup from fins/heatsink which block airflow and cause insulation issues.
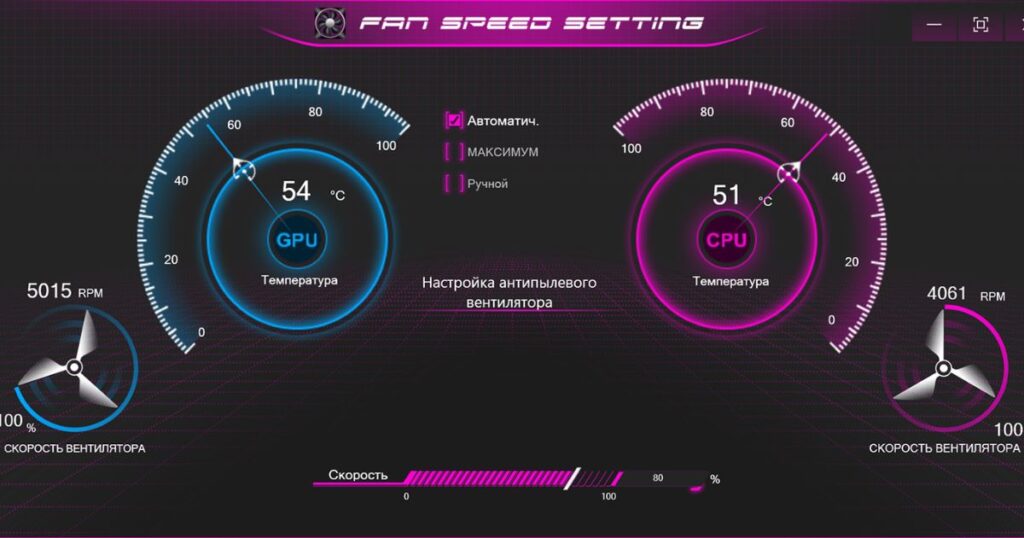
- Adjust Fan Curves – Use software like MSI Afterburner to set more aggressive fan profiles that kick in earlier to keep temps lower.
- Improve Case Cooling – Add additional case fans for positive pressure, ensure vents are not blocked, and try undervolting GPU for less power/heat output.
- Replace Thermal Paste – For older cards, cleaning and replacing the dried-out thermal paste between the GPU die and heatsink can lower temps by 5-10C.
- Check Heatsink Contact – Make sure the heatsink is firmly mounted with even contact on the GPU core to maximize heat transfer.
- Reapply Thermal Pads – For heavily used cards, old thermal pads can insulate more over time. Cleaning and reapplying new pads refreshes joint conductivity.
- Add Supplemental Cooling – Options like aftermarket heatsinks, active cooling backplates, or AIO/custom liquid cooling can drastically reduce temps in extreme cases.
- Undervolt Graphics Card – Reducing voltage at stock/moderate clocks using tools like MSI Afterburner cuts power usage and heat generation significantly with minimal loss in performance.
- Limit Framerate In-Game – Capping frame rates to your monitor’s refresh rate prevents excess GPU load and heat when it’s not needed for smooth visuals.
- Reapply Thermal Paste – As a last resort on stubborn high-temperature issues, completely removing the heatsink, cleaning both surfaces and applying high-quality thermal paste is recommended.
If these remedies do not help bring temperatures down below safe thresholds even with appropriate case cooling, it may be time to consider upgrading cooling components or possibly the entire graphics card depending on its age and condition. However diligent temperature monitoring plays a key role in diagnosing and solving heating issues.
Other Useful Monitoring Features
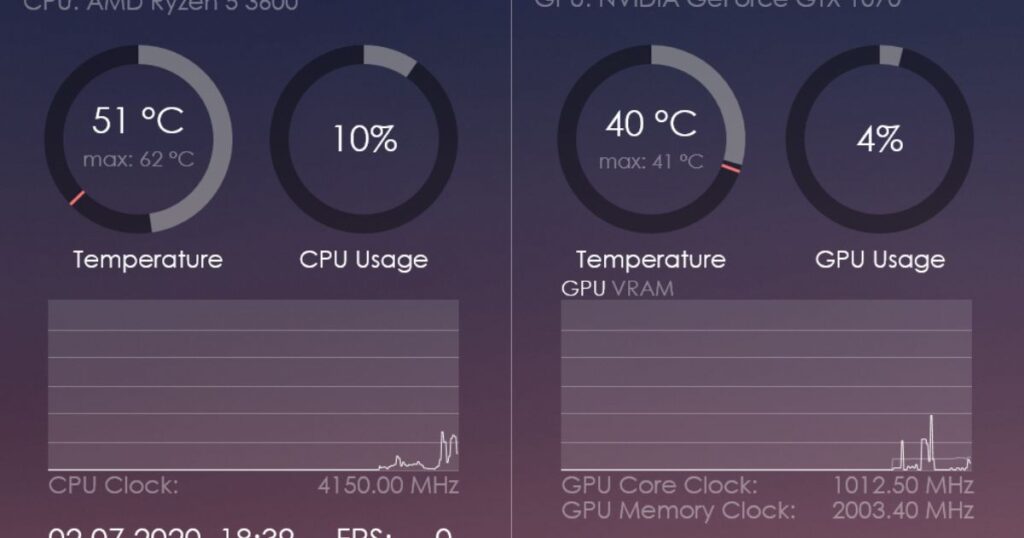
While core GPU temperature tells you the chip’s operating conditions, other parameters provide extra insight into overall system health:
- Memory Junction Temperature (VRAM) – Critical to monitor for some AMD cards with HBM2 memory. Can push thermal limits.
- GPU Hot Spot – Highlights maximum temp on the hottest part of the GPU core die which tells hot spots.
- Fan Speeds – Ensuring adequate airflow is provided as heat increases under load.
- Power Draw – Excessively high power usage indicates inefficiency potentially leading to overheating.
- Core/Memory Clock Speeds – Drooping clocks imply thermal throttling kicking in to protect components.
Hardware monitoring tools like MSI Afterburner, HWiNFO, and others report all these key parameters together in one place for a complete picture. Logs also help analyze trends over time.
Regular Maintenance And Monitoring Tips

To keep your GPU running its best while discouraging premature failure risks, consider implementing the following ongoing maintenance practices:
Check Temperatures Monthly
Monitor a few gaming sessions each month to watch for developing issues promptly.
Clean Fans/Heatsink Yearly
Remove built-up dust preventing airflow degradation annually or sooner depending on your environment.
Replace Thermal Paste Every 2-3 Years
Thermal materials break down over many heat cycles warranting periodic refreshing.
Buy Proper Case/PSU
Make sure your rig provides clean, filtered intake and positive air pressure for dust prevention.
Manage Cables/Clear Airflow
Route cables neatly and don’t obstruct ventilation with poor case management hurting temps long term.
Logging For Trends
Recording parameters over time lets you detect slow changes indicating impending maintenance needs.
Choose A Cooling Method
Find the optimal balance between fan noise, thermals, and reliability unique to your tastes and components.
Taking a bit of time periodically to check GPU temperatures through logging and monitoring sessions pays dividends in longevity for your expensive graphics cards. Diligent maintenance helps prevent emergencies down the road.
FAQ’s
How do I know if my GPU is overheating?
Your GPU is likely overheating if the temperature goes above 95C during normal use. You may also experience crashing, throttling, or performance issues.
How do I thermal test my GPU?
Run a GPU-intensive program like a benchmark or game for 30 minutes while monitoring the temperature. This stresses the GPU and shows you the max temp.
What is a bad GPU temp?
Most experts advise the maximum safe temperature for continuous use is around 85C. Sustained temps above 95C are considered too hot and could damage the GPU over time.
Is 50c hot for a GPU?
No, a temperature of 50C is quite cool for a GPU under load. Most GPUs will start to throttle around 85C, so 50C leaves plenty of thermal headroom and indicates good cooling is in place.
Conclusion
Maintaining healthy operating temperatures for your graphics card is an easy but often overlooked component of PC care. By learning how to properly monitor GPU temperature with either the official software utilities or trusted third-party tools, you gain valuable insight into the thermal performance and stability of your system.
Being able to spot issues early through regular temperature checks also helps avoid costly repairs. With careful maintenance like periodic dusting, thermal paste replacement, and fan speed optimization informed by monitoring data, you can extend the life of your GPU hardware for many years of flawless gaming and workstation use.
With the tips outlined in this guide, from understanding normal ranges to diagnosing unusual readings to addressing high-temperature situations, you now have everything needed to establish an ongoing GPU temperature monitoring routine. Be sure to periodically review sensor logs for trends and keep components running at peak efficiency through diligence with your graphics card’s thermal well-being.